
Indian Undergraduate Insight

Indian Undergraduate Insight
This section presents a snapshot of employment data specifically focused on Indian undergraduates, powered by ACG's comprehensive international graduate database. Here, you'll find average employability figures that highlight trends and insights related to the career prospects of Indian undergraduates. Feel free to use this data as a reference for understanding the employment landscape for Indian students abroad.
-- EMPLOYMENT DATA --
1. Average Employability

The employability of Indian undergraduates is 90.50%.
Indian Undergraduate Employability by Country

Those from New Zealand have the highest employability at 92.31%, followed closely by the UK at 91.01%, Australia at 89.89%, and the US at 87.18%.
Indian Undergraduate Employability by Universities
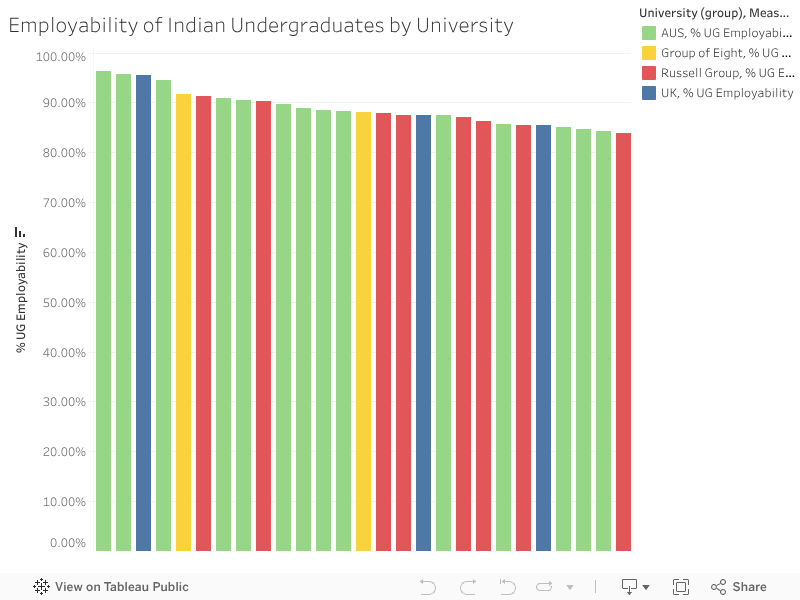
Indian undergraduates from Australia demonstrate higher employability compared to those from the UK. Half of the Group of Eight universities and half of the Russell Group universities report elevated employability rates compared to their counterparts.
2. Months to First Job
Average Months to First Job for Indian Undergraduates by University Category

Indian undergraduates tend to secure their first job more quickly at prestigious universities like the Group of Eight in Australia and the Russell Group in the UK, compared to the overall average in both countries. Among all four groups, the Group of Eight is the quickest, while Australia overall remains the slowest in terms of time to first employment.
Average Months to First Job for Indian Undergraduates by University
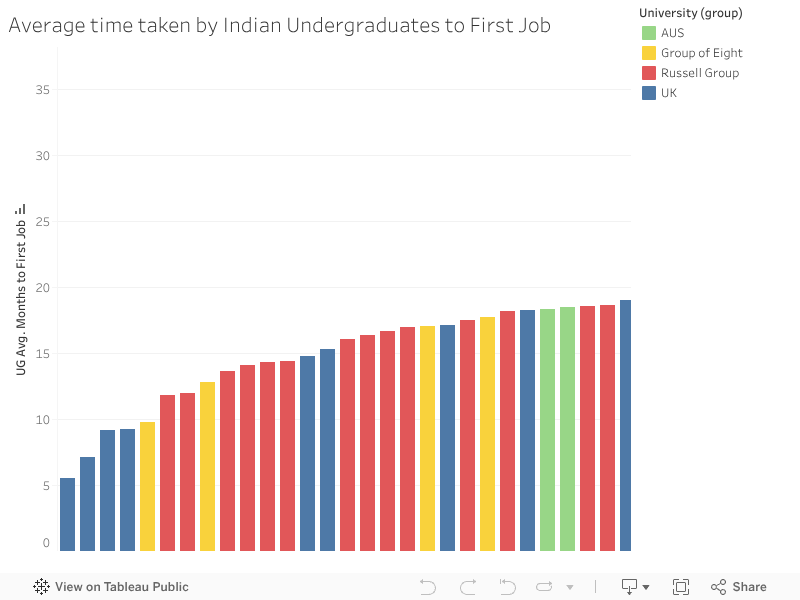
The data reveals a significant difference in the average time to first job among Indian undergraduates, with the highest being 36 months and the lowest around 5 months, resulting in a difference of approximately 31 months.
Indian graduates from the Group of Eight and Russell Group universities tend to find jobs quicker, averaging about 18 months—8 months faster than their peers in Australia and 3 months faster than those in the UK.
The graph reveals that UK universities typically facilitate faster job placements for students compared to Australian universities. Interestingly, the top four UK institutions with the quickest job placement times are not part of the Russell Group. In addition, two universities from Australia’s Group of Eight also show quicker job placement for Indian undergraduates.
3. Average Annual Salary
Average Annual Salary of Indian Undergraduates


Indian Undergraduates on average earn an annual salary of £5,069.
The average annual salaries of Indian graduates vary significantly by location and field. Australia offers the highest salary at £5,261, followed by the UK at £5,013, while the US provides £4,890 and New Zealand the lowest at £3,454.
In terms of disciplines, STEM graduates earn an average of £5,342, reflecting strong demand for technical skills, followed by Business graduates at £5,087, and other fields at an average of £4,685.
Average Annual Salary of Indian Undergraduates by University
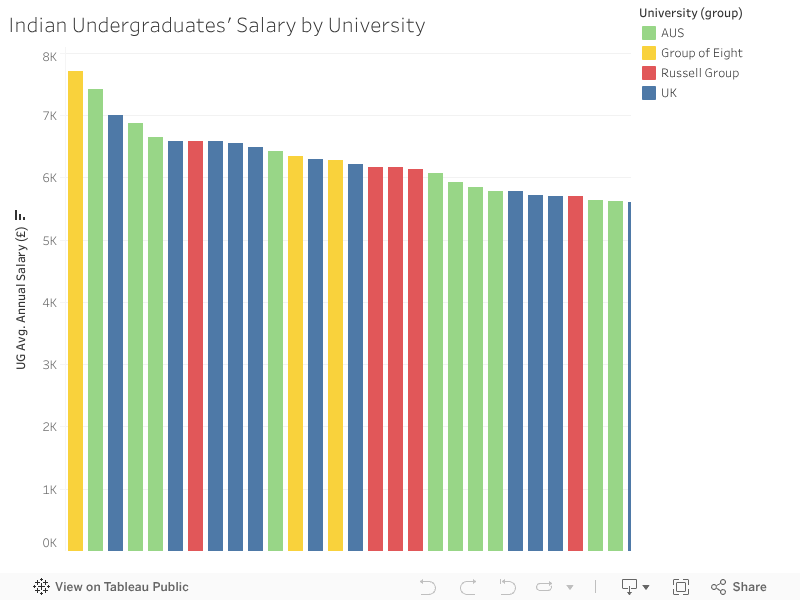
The institution Indian undergraduates graduate from does not seem to have a significant impact on their starting salary. However, the graph shows that the top 5 earners are primarily from Australian institutions, with 4 coming from Australia (including 1 from the Group of Eight) and 1 from the Russell Group. Russell Group and other UK institutions display more consistency in salary outcomes. Notably, despite having good salary averages, the bottom 5 earners are also from Australian institutions.
The salary gap between the highest and lowest-earning universities ranges from approximately £4,998 to £5,845.
4. Entrepreneurship
Are Indian Undergraduates likely to start their own businesses after studying abroad?

Approximately one in three Indian graduates—specifically, 31.07%—will pursue entrepreneurship. This trend indicates a growing interest in self-employment and innovative ventures among recent Indian undergraduates.
Where did Indian Undergraduate Entrepreneurs pursue their studies?


In Australia, Indian undergraduates make up 13.78% of the total entrepreneurial population, while in the UK, they represent 25.27% of all entrepreneurs. This means that one in seven entrepreneurs graduating from an Australian university is an Indian undergraduate, compared to one in four graduate from a UK university.
What degrees did Indian undergraduates entrepreneurs pursue?

The majority of Indian undergraduates who became entrepreneurs studied Business, accounting for 51.49%. STEM fields followed at 25.37%, while other degrees made up 23.13%.

The data shows that Indian undergraduates in Australia are more likely to study Business before becoming entrepreneurs, with 57.94% choosing this field compared to 50.55% in the UK (7.39% difference).
For STEM fields, 21.50% of Indian undergraduate entrepreneurs pursued STEM degrees in Australia, while in the UK, this figure is higher at 25.83% (4.33% difference).
In terms of other degrees, 20.56% of entrepreneurs in Australia studied these fields, while 23.62% in the UK did the same (3.06% difference).


